| |
|
You Are Here: Vermont Department of Labor ELMI ELMI |
| |
 |
Economic & Labor Market Information |
 |
| |
| |
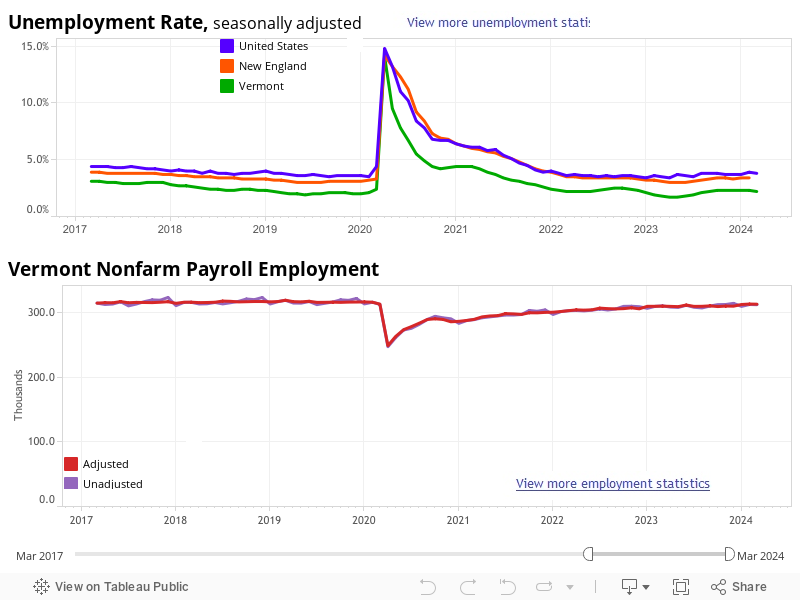
September 2025 Unemployment and Jobs Press Release 
December 11, 2025 |
|
| Commissioner's Message |
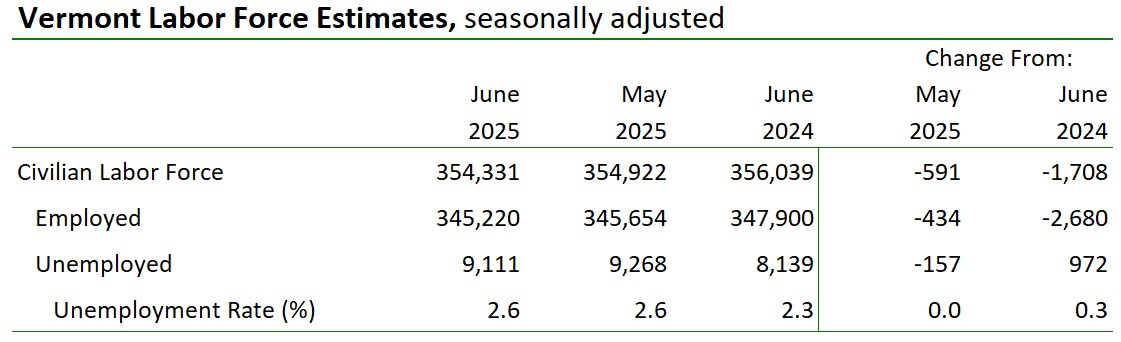
| "Following the end of the federal shutdown, the monthly data releases for Vermont’s labor market can resume. This release covers data for September 2025, and additional releases for the remaining months of 2025 will be issued in January 2026.
In the September data, the household survey shows continuing downward pressure on the Vermont labor force,” said Kendal Smith, Vermont Department of Labor Commissioner. “The Department is continuing its ongoing workforce development and training activities statewide. These include services for job seekers, such as assistance with résumé preparation and interview skills, as well as services for employers, including hosting job fairs and screening candidates. Recently, the Department hosted a successful statewide part-time job fair that connected 230 jobseekers with over 30 employers representing retail, logistics, healthcare, manufacturing, food service and more, and we will be offering other such activities in the New Year."
|
| |
| |
 |
|
| Schedule of Upcoming Unemployment and Jobs Press Releases through January 2026. |
| |
What's new? |
Unemployment Weekly Report - December 18, 2025
Find the latest information on claims, unemployment insurance statistics
and unemployment rates for New England states and the U.S. This and more UI reports
are at Publications
Dec-18-2025A report on the Vermont Unemployment Insurance Program showing trust fund, benefit, wage information and more.
This and more UI reports are at Publications.
Oct-3-2025Vermont Per Capita Personal Income revised estimate for 2024 is $71,287 (current dollars), increasing the State's ranking to 19 th highest.
Charts and data available at Wages & Income.
Sep-29-2025Find tables on initial claims, weeks claimed, unemployment compensation payments and more,
all based on the Vermont Unemployment Insurance Program.
This and more UI reports are at Publications.
Aug-29-2024 |
|
|
|
|
|
|
|
|
|