| |
|
You Are Here: Vermont Department of Labor ELMI ELMI |
| |
 |
Economic & Labor Market Information |
 |
| |
| |
June 2025 Unemployment and Jobs Press Release 
July 18, 2025 |
|
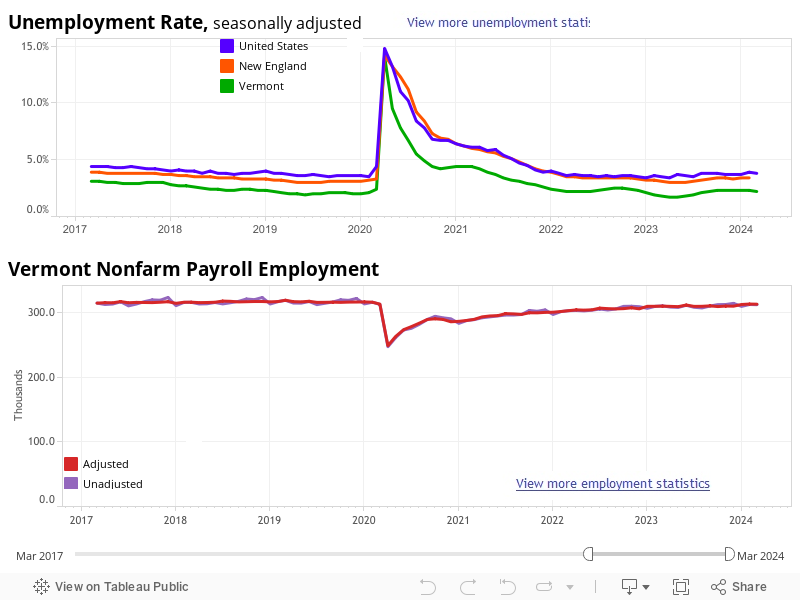
| "Preliminary data from June shows that Vermont's labor force has declined for the fifth month. While the decrease is less than one percent, it reflects a broader trend across Vermont and the nation: an aging workforce.
That's why our work at the Department of Labor is more critical than ever. We're here to support job seekers at every stage of life, from helping young people gain experience through summer jobs to partnering with community organizations who specialize in opportunities for older workers.
Whether you're just starting or planning your next career move, your local Department of Labor office is here to help. Learn more at labor.vermont.gov."
|
Kendal Smith
Interim Commissioner |
| |
| |
 |
|
| Schedule of Upcoming Unemployment and Jobs Press Releases through January 2026. |
| |
What's new? |
Unemployment Weekly Report - August 14, 2025
Find the latest information on claims, unemployment insurance statistics
and unemployment rates for New England states and the U.S. This and more UI reports
are at Publications
Aug-14-2025Covered Employment and Wage information is combined with Unemployment Compensation Benefits in this UI report available at Publications.
Jun-27-2025Vermont Per Capita Personal Income grew to $70,086 (current dollars) in 2024, ranking the state at 21 st highest.
Charts and data available at Wages & Income.
Apr-8-2025There were 5,283 fatal work injuries recorded in the United States in 2023, a 3.7 percent decrease from 5,486 in 2022,
the U.S. Bureau of Labor Statistics reported today.
In Vermont, there were 16 fatal work injuries in 2023, up from 11 in 2022.
For more, see Industries.
Dec-19-2024Vermont's 2023 Real Per Capita Personal Income is $57,521, ranking the state 23rd highest.
Charts and data are at Wages & Income.
Dec-16-2024Nationally, private industry employers reported 2.6 million nonfatal workplace injuries and illnesses in 2023, down 8.4 percent
from 2022. In Vermont, 9,600 were reported in 2023. More information at Industries.
Nov-12-2024 |
|
|
|
|
|
|
|
|
|
 |
|
|
|
| |
|
 |
Data Releases |
 |
|
|
Aug-12-2025
Aug-12-2025
Unemployment and Jobs Numbers - June 2025
Jul-18-2025
Our most popular publication of state and county economic data has been updated.
Included are county commuting patterns along with
other regional information on income, population, housing, and employment.
- 2025 Economic & Demographic Profile Series
Jul-1-2025
Prevailing Wage rates required under the Capital Construction Act for state construction projects
have been updated and are effective from July 1, 2025 to June 30, 2026.
Note: New Registered Apprentice Rates
Jul-1-2025
The 2022-2032 Long Term Occupational Projections for Substate areas are now available, in addition to previously released Statewide data. Find the top occupations in growth, openings and by required level of education.
- 2022-2032 Long Term Occupational Projections
Occupational Projection tables
- Statewide HTML | XLS
- Burlington-South Burlington, VT Metropolitan NECTA HTML | XLS
- Northern Balance Of State HTML | XLS
- Southern Balance Of State HTML | XLS
May-21-2025
Apr-1-2025
Mar-24-2025
|
|
|
|
|
|
|
|
|
| |
|
|
Quick Stats |
|
|
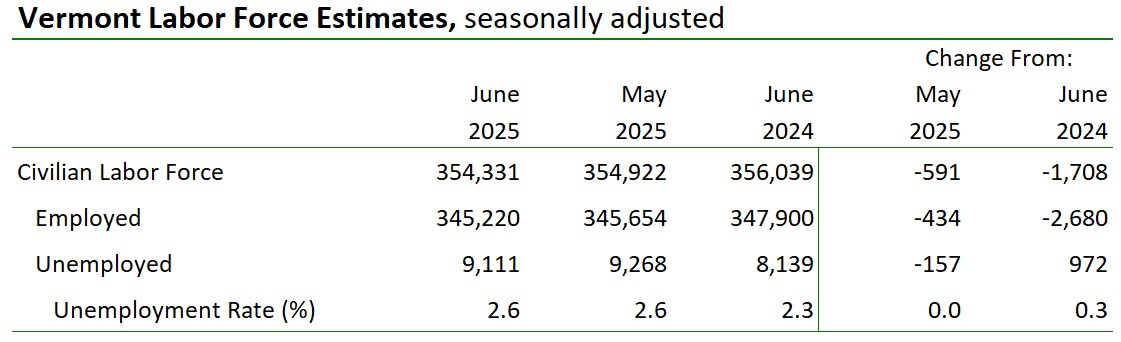
| Unemployment Rate |
| Seasonally Adjusted |
| |
Jun
2025 |
May
2025 |
Jun
2024 |
| Vermont |
2.6 |
2.6 |
2.3 |
| New England |
n/a |
4.2 |
3.5 |
| United States |
4.1 |
4.2 |
4.1 |
|
|
|
| |
|
|
|
|
|
|
|
|
|
|
|
|